On this page
The key distinction is separation versus detection
HPLC means high-performance liquid chromatography. A liquid carries the sample through a column containing a stationary phase. Components interact differently with that phase and can leave the column at different times. Those times are called retention times.
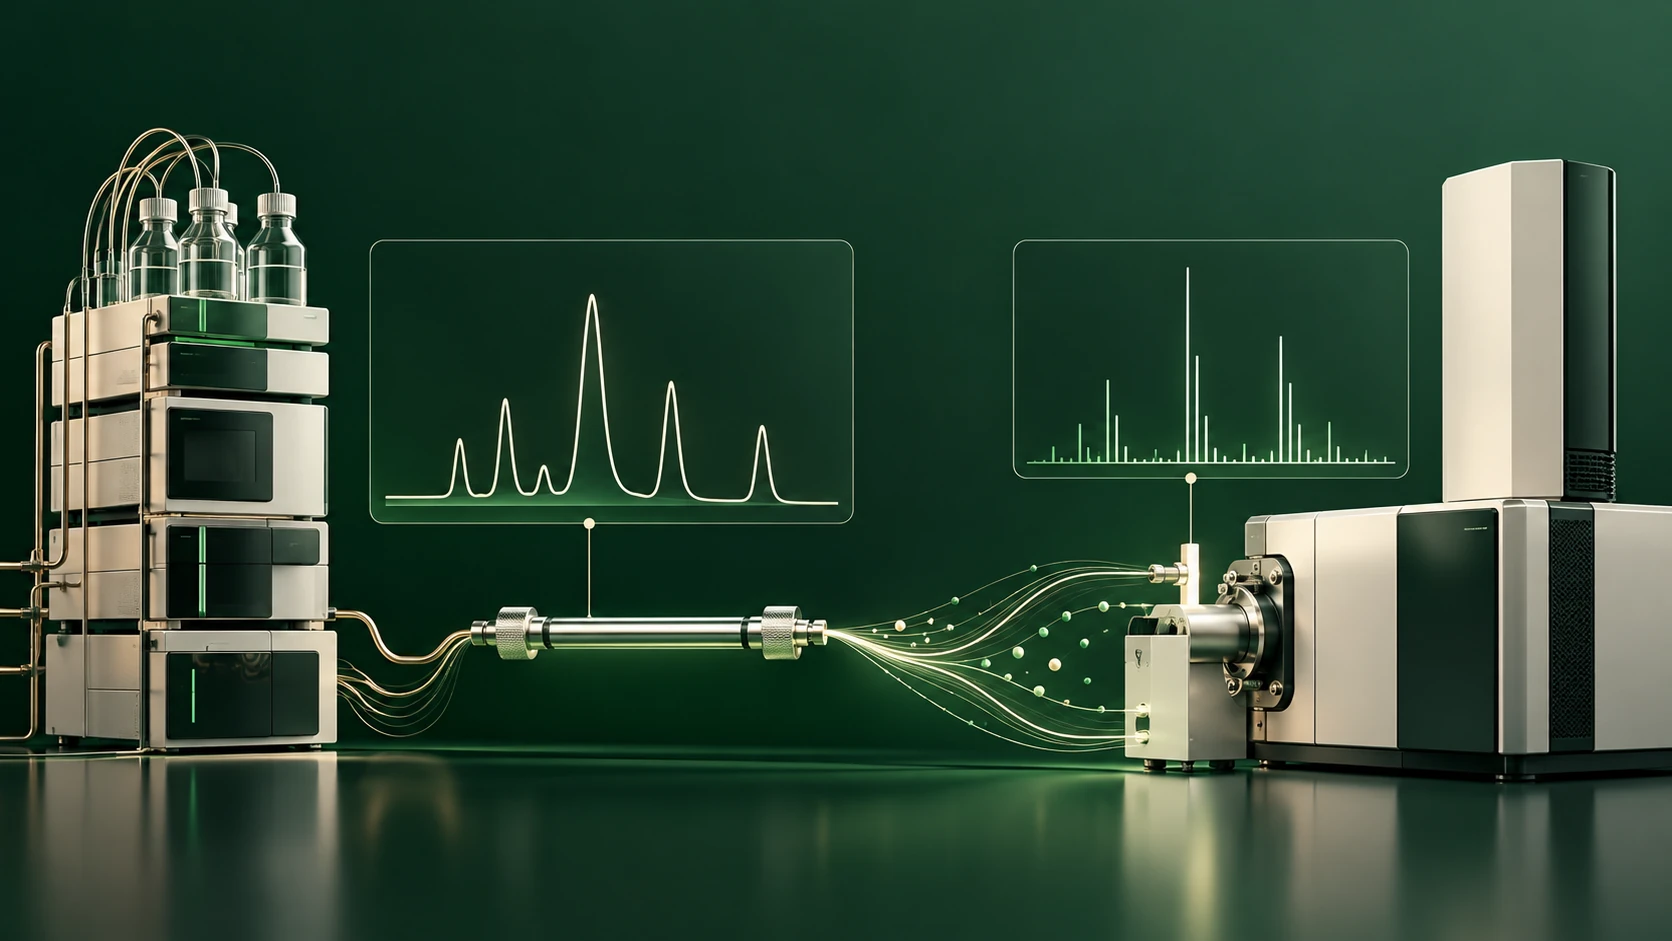
LC-MS couples liquid chromatography to mass spectrometry. The chromatography in an LC-MS system can itself be HPLC. The useful comparison is therefore usually HPLC with ultraviolet detection, or HPLC-UV, versus LC with mass-based detection, rather than chromatography versus an entirely separate technique. The Agilent synthetic-peptide technical reference illustrates these combinations.
That distinction prevents a common misunderstanding: an LC-MS result still depends on the separation before the mass spectrometer. Adding a more selective detector does not make poor separation irrelevant.
What an HPLC-UV chromatogram tells you
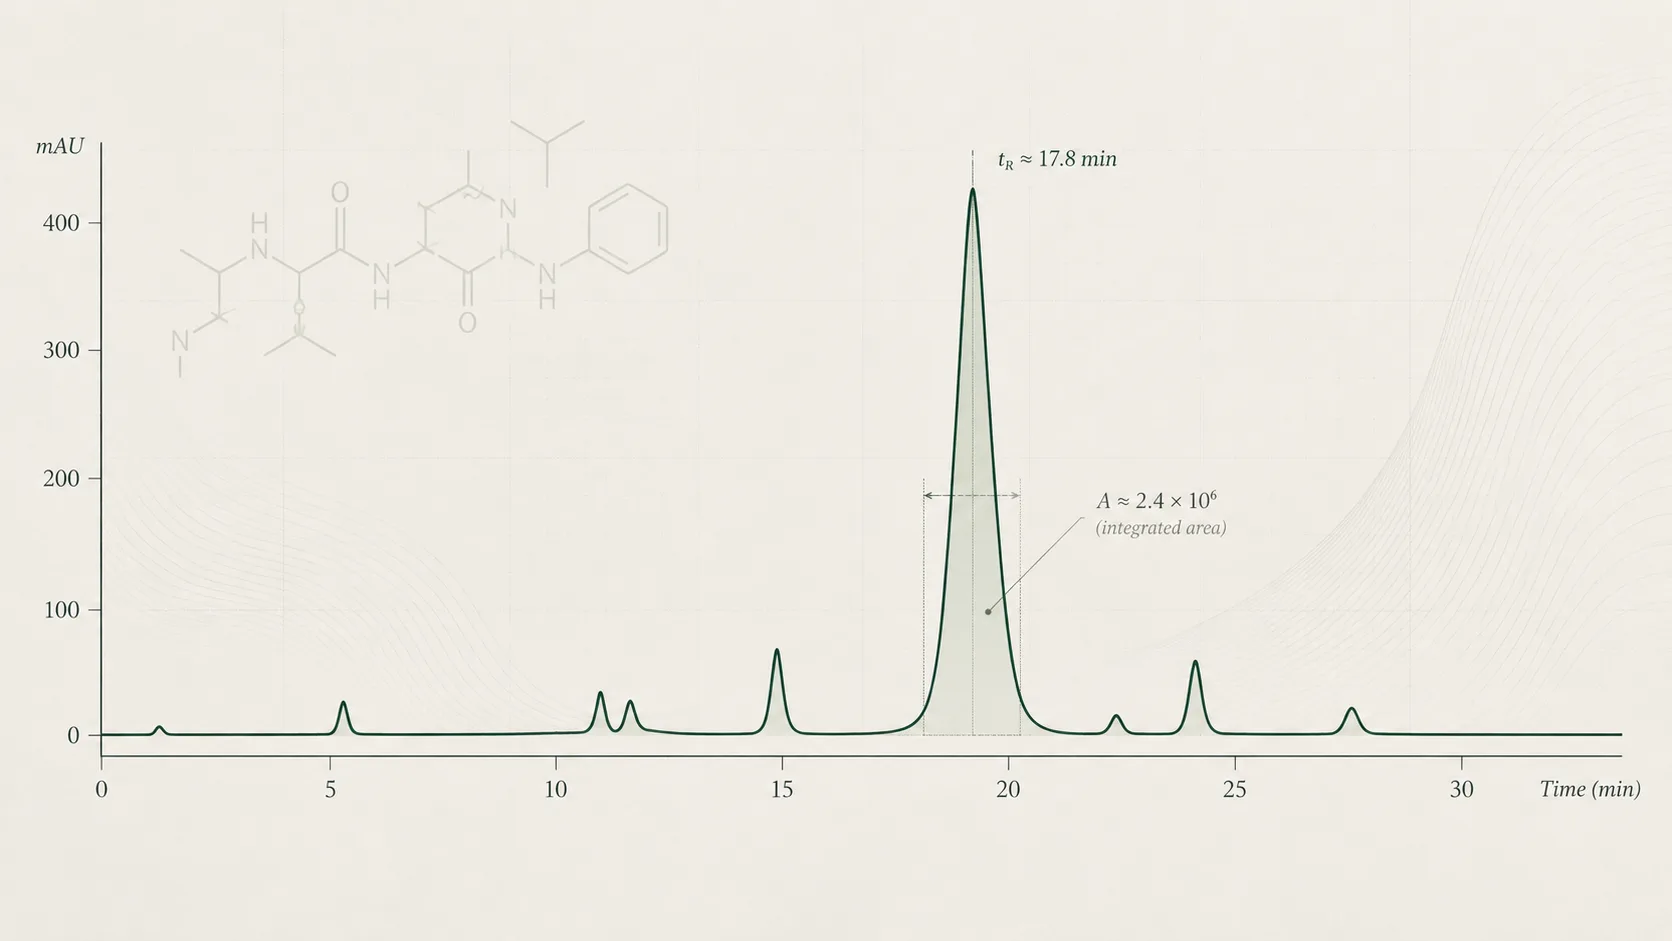
A UV detector records how strongly the material leaving the column absorbs light at the selected wavelength. A chromatogram plots that response against time. Peak area is the integrated detector response across a peak.
A reported chromatographic area percentage compares the assigned main peak with the other integrated peaks under that method. It is not automatically the percentage of every substance in a vial. Components may co-elute, absorb differently or fall outside the reported measurement. Water and counterions also require their own assessment.
A single peak means the method recorded one resolved feature. More than one component can contribute to it. Retention time can help compare a sample with a suitable reference, but it is not a unique molecular fingerprint. HPLC Peptide Purity Explained covers chromatogram interpretation in more detail.
What LC-MS adds
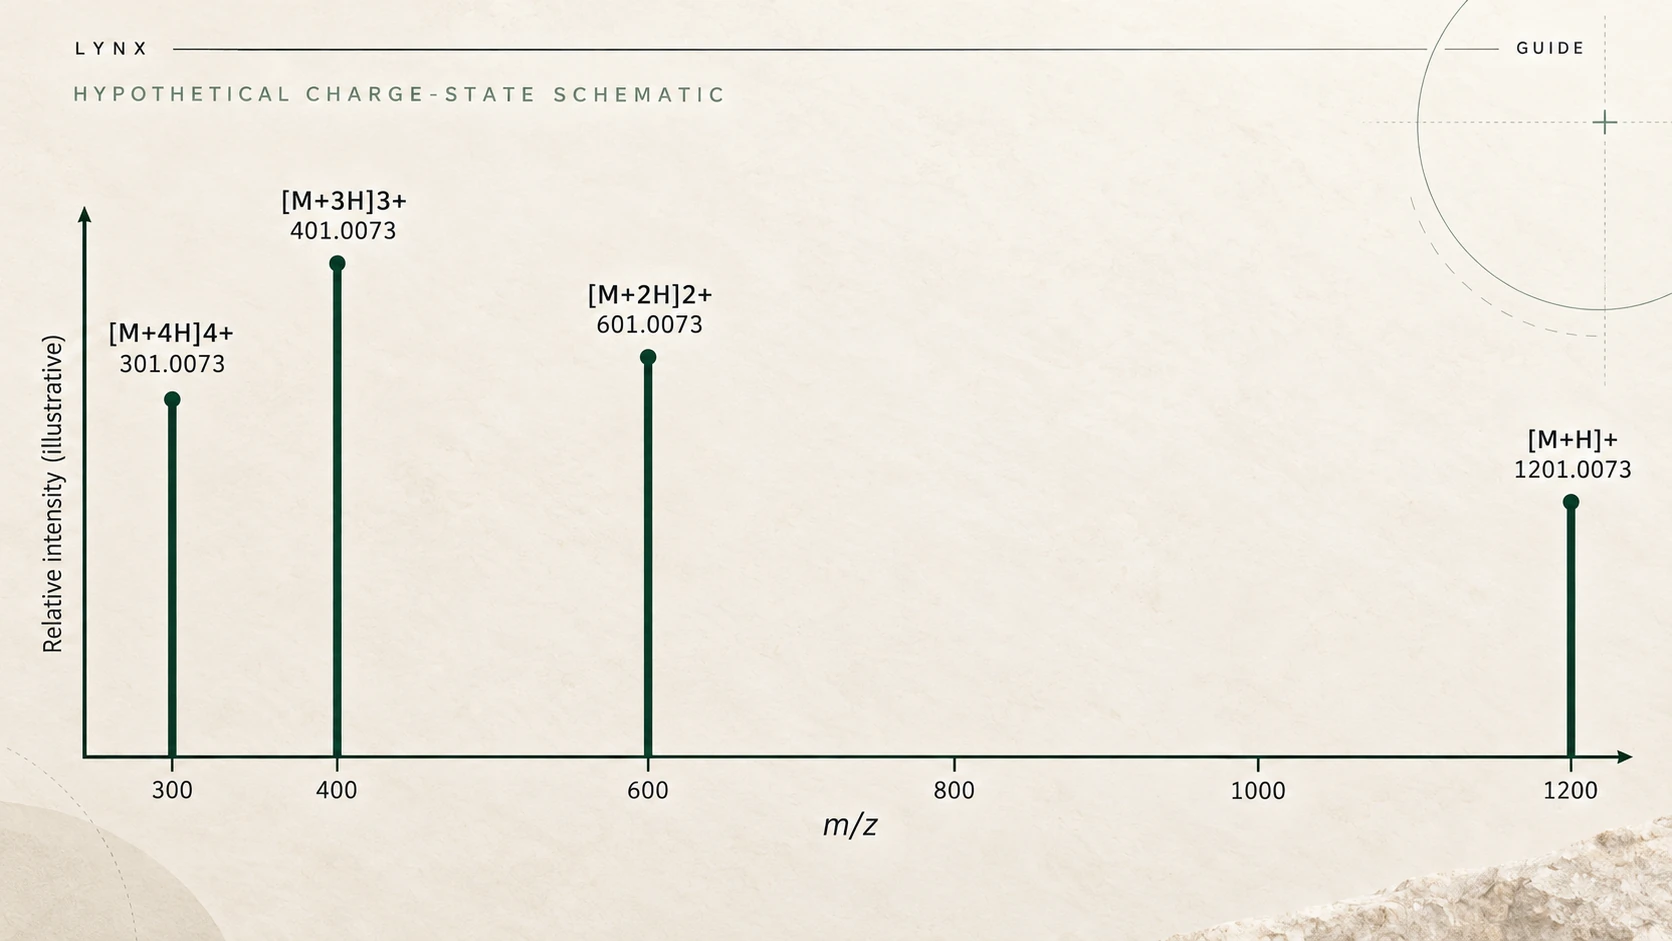
The mass spectrometer measures ions by mass-to-charge ratio, written m/z. A peptide can produce several charge states, so one molecule may generate several signals. Those signals can be interpreted to estimate its molecular mass.
Mass information helps test whether the proposed peptide is consistent with the detected material, and can distinguish some components that overlap chromatographically. Tandem mass spectrometry, or MS/MS, selects ions and examines fragments, adding structural evidence where the fragmentation and interpretation are suitable.
An intact-mass match is still not a complete sequence or stereochemical determination. Some different molecular arrangements have the same mass. The mass spectrometry Guide explains charge states, fragmentation and these identity questions.
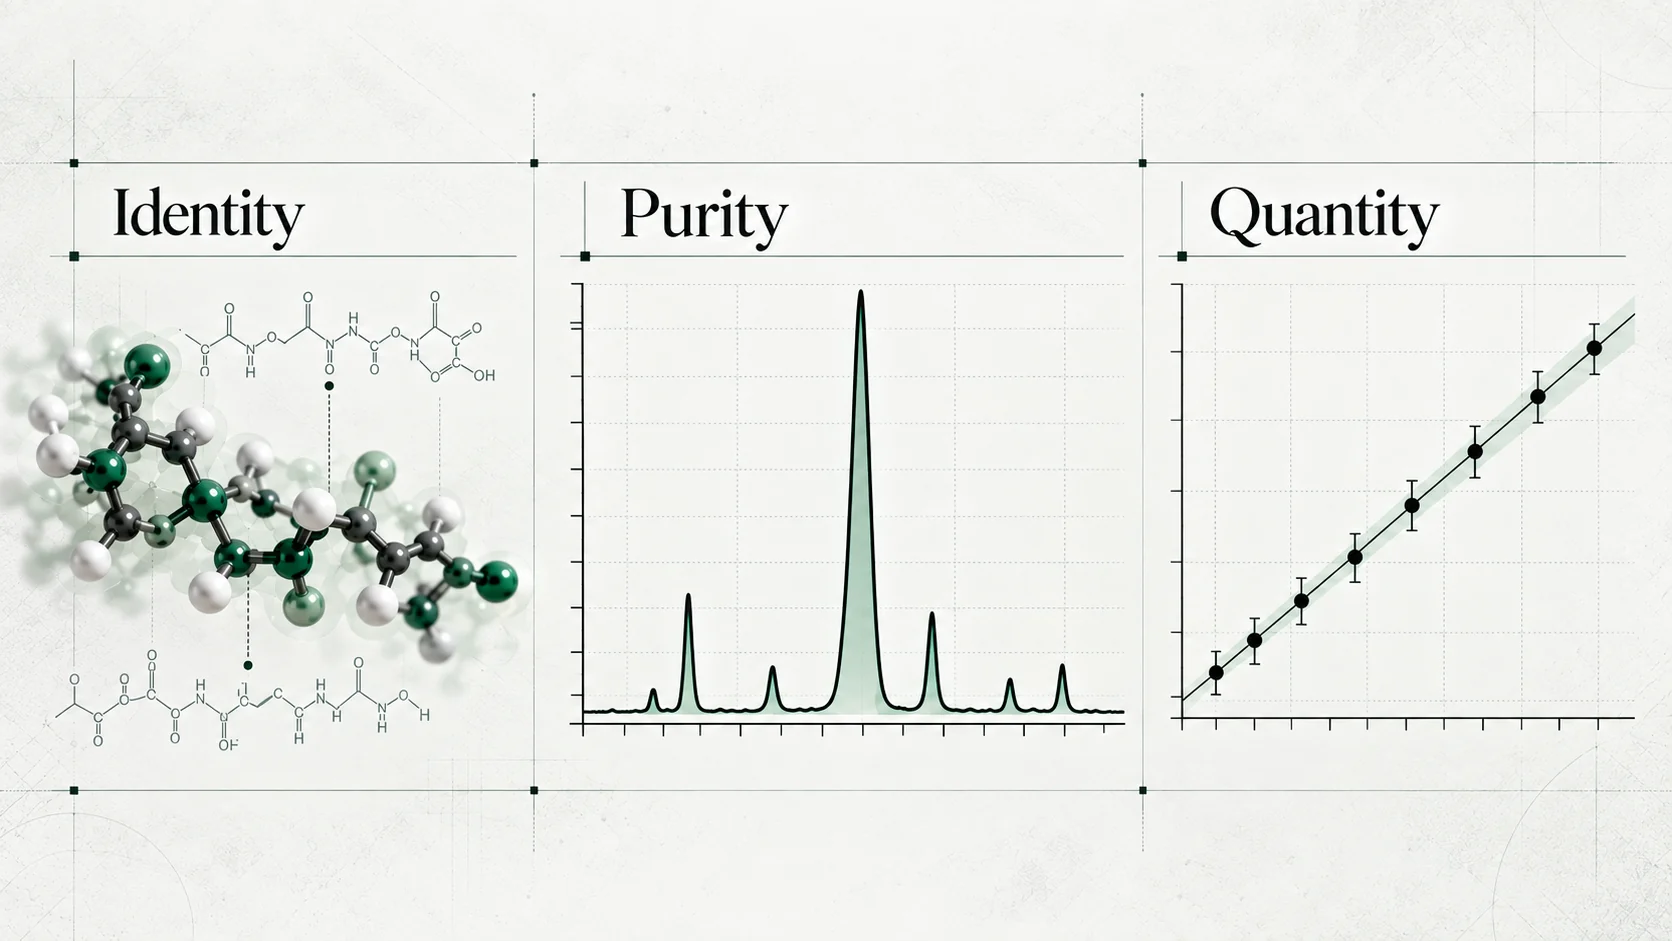
Purity, identity and quantity are separate questions
| Question | Typical evidence | What still needs checking |
|---|---|---|
| Chromatographic purity | Relative areas in a specified chromatogram | Resolution, detector response, integration and reporting thresholds |
| Molecular identity | Mass, fragments and comparison with a defined structure or reference | Which structural features the method can distinguish |
| Quantity or content | A calibrated measurement of a defined analyte | Reference value, sample recovery, uncertainty and the basis of the result |
Both UV and MS can support quantitative methods when they are calibrated and validated for that purpose. Neither a peak-area percentage nor an uncalibrated ion intensity states the absolute peptide amount. The NIST-linked metrology review using angiotensin I discusses purity assignment and measurement traceability. Understanding Peptide Analytical Testing explains how to keep the three questions distinct.
Why the methods complement each other
Consider an illustrative report with a dominant UV peak and a mass consistent with the expected peptide. The UV result describes the relative chromatographic response. The mass result supports part of the identity assessment. Neither alone confirms the labelled amount.
If the UV peak looks clean but additional masses occur at the same retention time, co-elution is a question worth investigating. If the main mass differs from the proposal, a high area percentage cannot repair the identity mismatch. These are interpretation examples, not Lynx batch findings.
Different measurement principles can help resolve an analytical question that one method leaves open. ICH Q2(R2) sets out that principle through specificity and complementary procedures. It is cited for analytical reasoning, not as a claim that a research product meets medicinal-product release standards.
For a sample labelled BPC-157, UV peak area, mass-based identity evidence and calibrated content measurements answer different questions. This example illustrates report interpretation, not testing on a Lynx batch.
The method conditions are part of the result
LC-MS response depends on ion formation as well as the amount reaching the instrument. Other sample components can suppress or enhance the signal. A weak signal may therefore reflect the analytical environment rather than a small quantity of peptide.
Mobile-phase additives also matter. TFA can benefit peptide peak shape in UV methods while suppressing electrospray response. Waters discusses that trade-off. Transferring a separation from UV detection to MS can require method development, not simply connecting a different detector.
Compare reports only after checking the method, sample identity, detector settings and reporting basis. “HPLC tested” and “LC-MS tested” name technologies. They do not explain what was established for a particular sample.
Read the conclusion alongside its supporting evidence
- Match the sample and batch identifiers.
- Identify the detector and the purpose of each test.
- Read purity as the stated method result, including its integration basis.
- Check expected versus observed mass and any supporting structural evidence.
- Look for a separate calibrated content measurement where quantity matters.
The Certificate of Analysis Guide applies these questions to a report. The lab-report library contains available Lynx documents. Only the results actually reported should be attributed to a batch.
Lynx materials are for laboratory research only, not for human or veterinary use. This Guide provides no dosing, administration or personal-use preparation instructions.
References and further reading
- Synthetic Peptides: Chromatographic Methods for Separation, Quantification, and Characterization. 2024. instrument manufacturer technical reference.
- ICH Q2(R2): Validation of Analytical Procedures. 2023. authoritative analytical guideline.
- State-of-the-art and trends for the SI traceable value assignment of the purity of peptides using the model compound angiotensin I. Josephs et al.. 2018. DOI 10.1016/j.trac.2017.09.026. metrology review, NIST publication record.
- Do we need to compromise sensitivity and peak shape with TFA or formic acid?. instrument manufacturer technical reference.