On this page
What HPLC does in peptide analysis
High-performance liquid chromatography, or HPLC, separates components of a sample before a detector records them. A liquid mobile phase carries the sample through a column containing a stationary phase. Different interactions with those phases can cause components to reach the detector at different times. IUPAC's chromatography definition provides the underlying terminology.
Peptide analysis often uses reversed-phase HPLC. It can help separate the intended peptide from related material formed during synthesis or subsequent change. Separation is useful because a mixture can then be examined as a series of signals rather than one combined observation. The technique is not a complete inventory of everything in the original material.
Analytical HPLC examines a sample. Preparative HPLC collects separated material. Using chromatography to purify a peptide and reporting a later analytical purity result are different steps. An Agilent synthetic-peptide study illustrates separation and reanalysis under different conditions. It is a method example, not evidence about Lynx products.
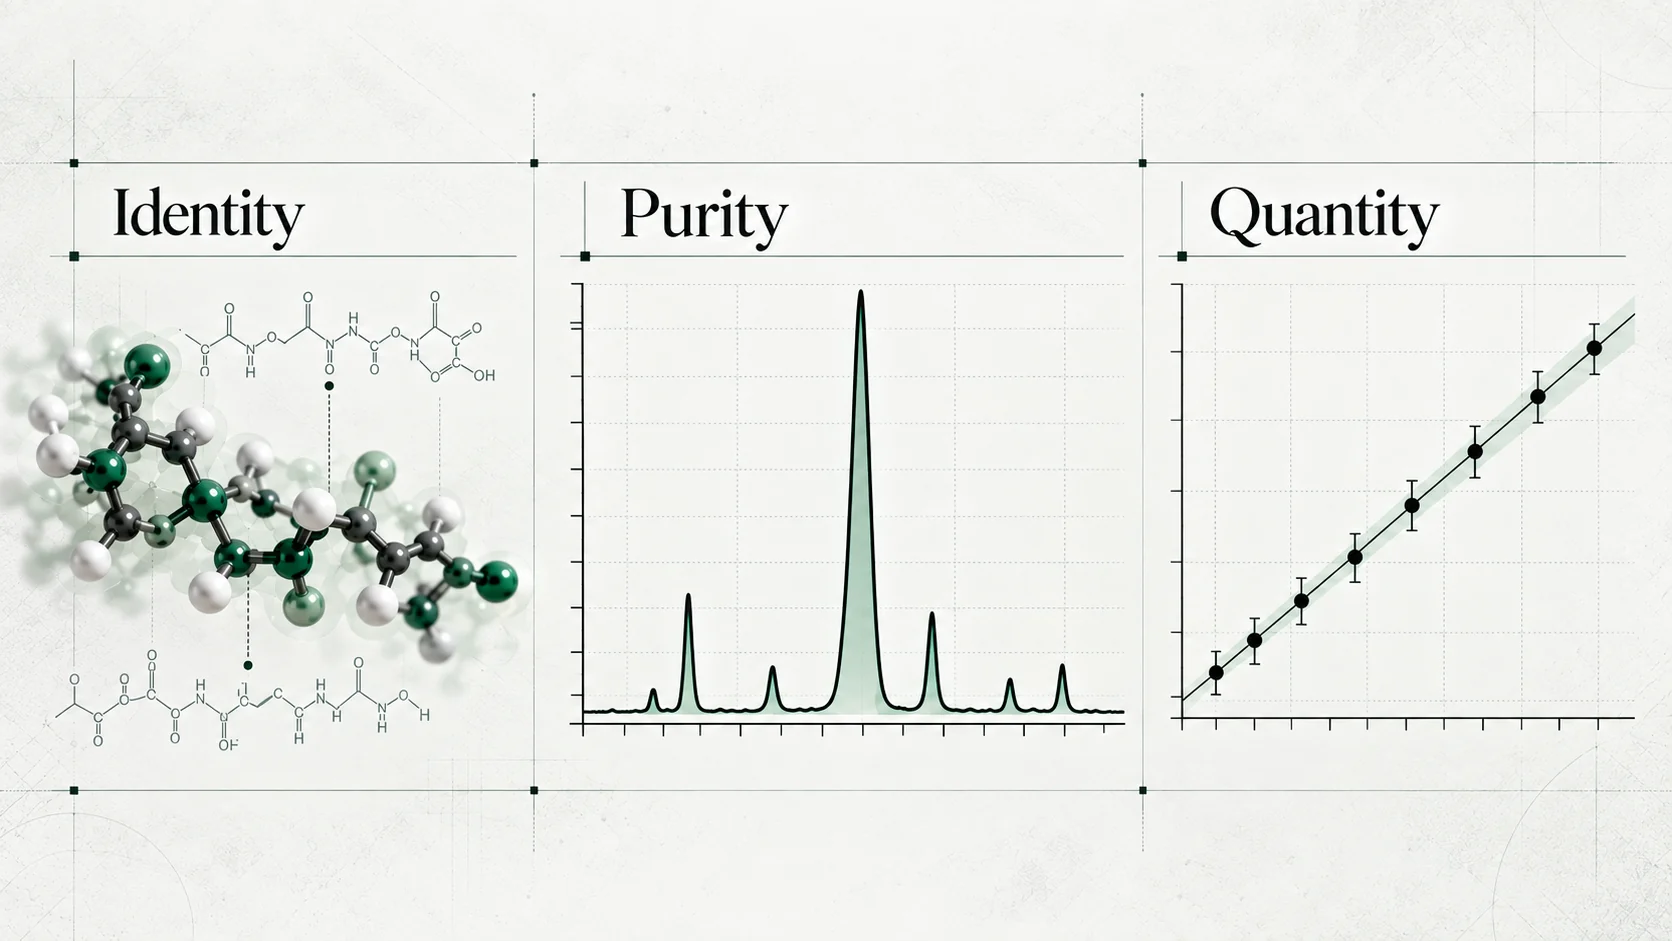
For the broader distinction between identity, purity and quantity, see Understanding Peptide Analytical Testing. Here, the focus is what happens between a chromatographic signal and a reported percentage.
Reading a chromatogram
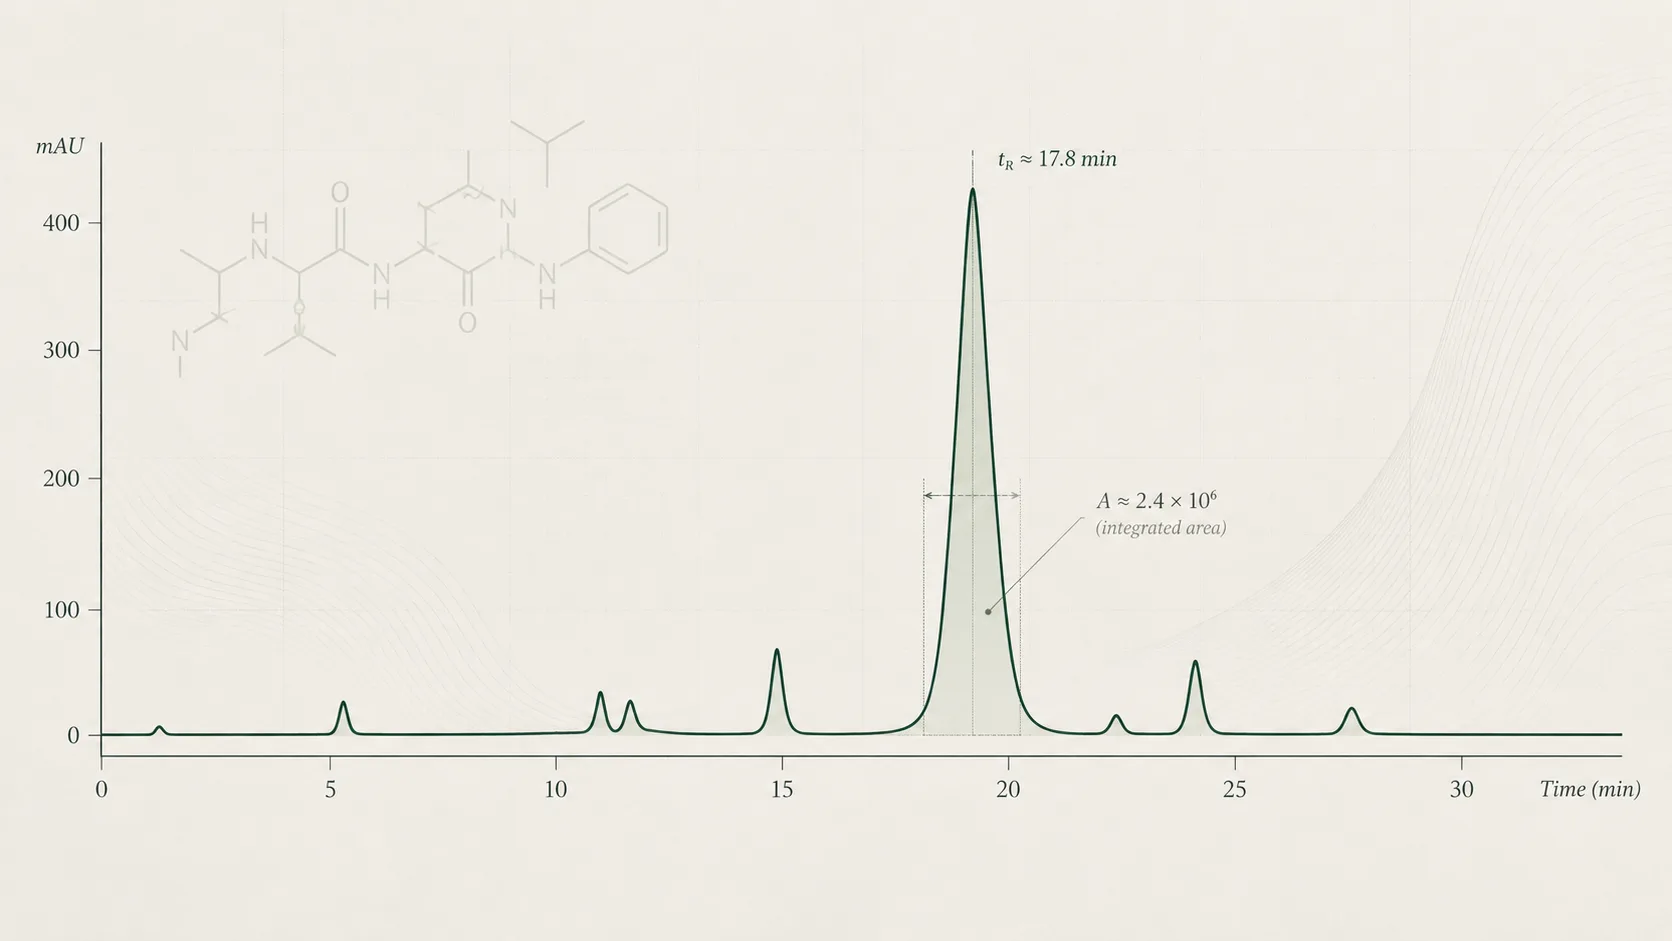
A chromatogram usually plots detector response against elapsed time. In an HPLC-UV trace, the vertical axis commonly shows absorbance units, while the horizontal axis shows minutes. Other detectors produce different signals and units. IUPAC's chromatogram definition covers this relationship between response and time or elution volume.
| Feature | What to read |
|---|---|
| Time axis | When a signal reaches the detector during the recorded run |
| Response axis | The detector signal and its units, not an unlabelled measure of sample mass |
| Baseline | The reference signal used when calculating a peak's area |
| Peak apex | The highest point of a peak, commonly used to report its retention time |
| Peak area | The integrated signal between the peak and its baseline |
| Peak table | The reported times, areas, assignments and calculated percentages |
A peak is a rise and fall in the detector signal. It may contain one separated component or contributions from more than one. Peak height describes the maximum response. Peak area includes the signal across the peak's width. A taller peak is therefore not necessarily the one with the larger area. The IUPAC peak-area definition makes the baseline part of that measurement.
How area percentage is calculated
For an uncorrected area-normalisation calculation:
Assigned main-peak area % = assigned main-peak area ÷ total area of the included peaks × 100.
The denominator needs attention. It is the sum of the signals included by the method and processing rules, not the total mass of the original sample. Different calculations may use response-corrected areas or compare impurities with the main component instead. Waters' calculation documentation distinguishes these expressions.
That result says the assigned peak dominates the integrated response under the stated method. It does not identify every contributing component, establish a mass fraction or measure container content. The remaining 0.8% is an area share, not an automatically known impurity mass.
When a report says “99% HPLC purity”, first establish whether it means this area calculation. Do not add a measurement basis that the document has not supplied.
Why area percentage is not mass purity
Area percentage compares signals. Mass purity compares the mass of a specified substance with the mass of a defined material. Connecting the two requires evidence about response and the components included in the assessment.
An impurity giving a weak response can contribute less area than its amount might suggest. A strongly responding impurity can contribute more. Where relative response factors are established, an analytical calculation may correct for differences. That correction must have a justified basis. Software support for a correction does not demonstrate that the chosen factor is appropriate for every impurity. Waters explains how its relative-response-factor field changes calculated areas.
Peptide materials can also contain water, counterions and other constituents needing separate assessment. The BIPM CCQM-K115 peptide comparison assessed peptide-related impurities, water and counterions using complementary measurements. It also examined the consequences of assuming equal response.
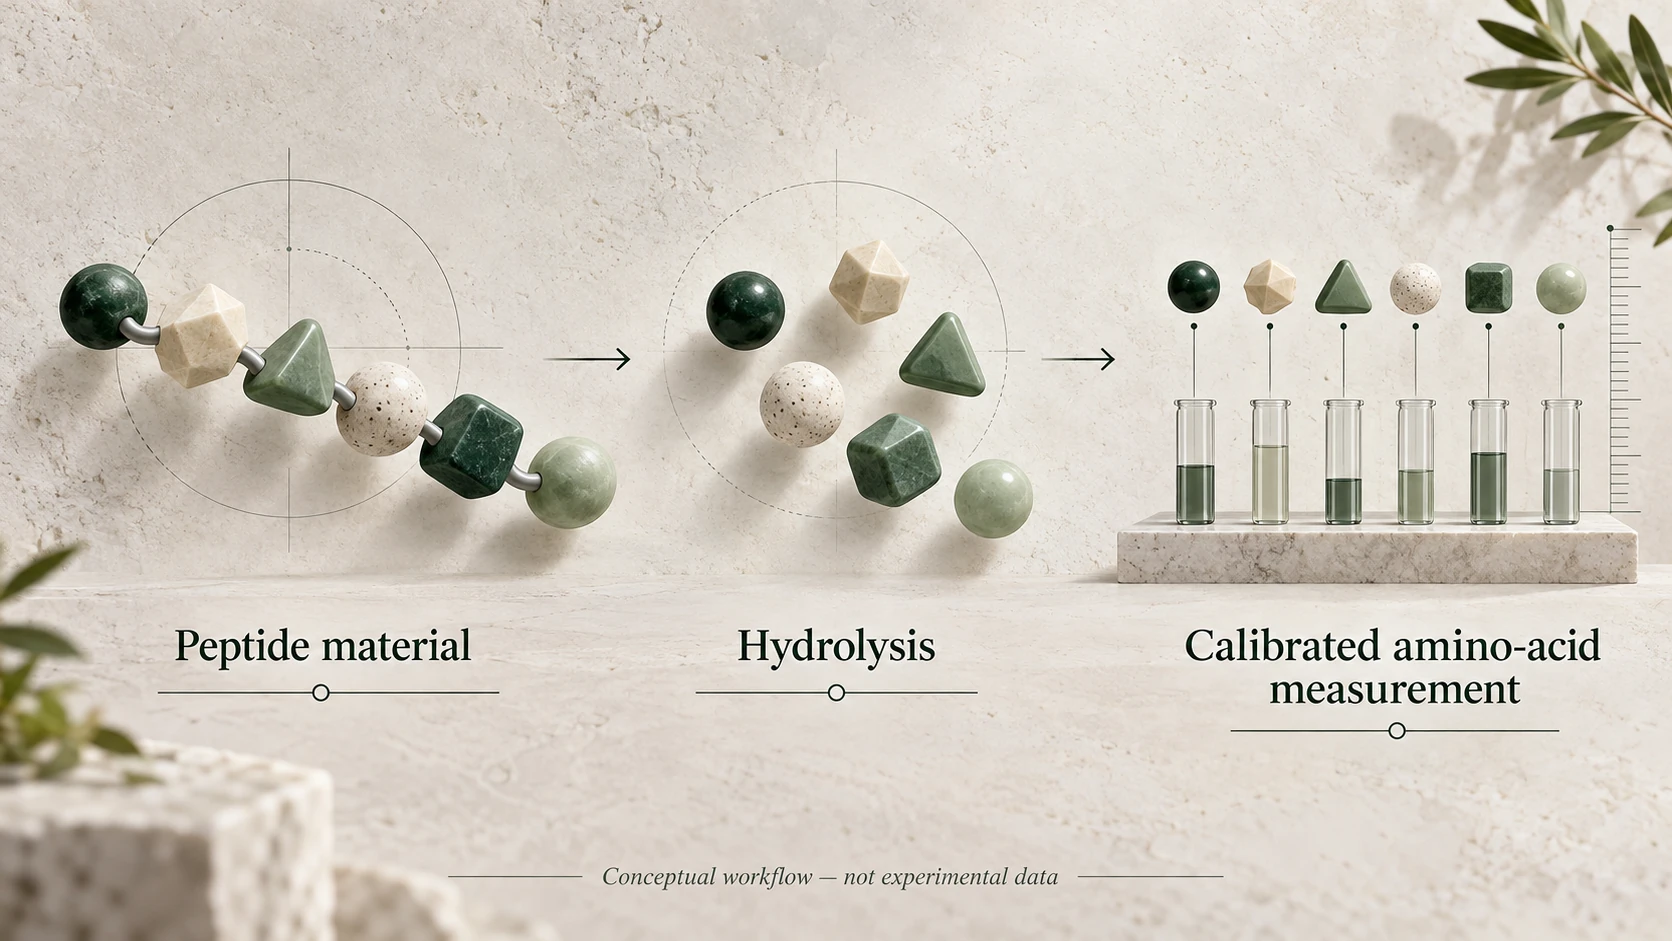
NIST's peptide reference-material research compares mass balance, impurity-corrected amino-acid analysis, elemental analysis and quantitative NMR for assigning peptide mass fraction. These studies show why a mass-based conclusion involves more than reading one chromatographic percentage.
Detector response and wavelength
HPLC describes the separation technique, not a universal detector. UV detection records light absorption at the selected wavelength. Response depends on the absorbing structures and the measurement conditions.
Peptide methods may use wavelengths around 214 or 220 nm, where peptide-bond absorption is useful. Detection around 280 nm is more influenced by certain aromatic residues. A validated insulin/pramlintide HPLC study compared wavelength choices and found different responses. Its particular findings should not become a universal wavelength rule for every peptide.
The practical question is whether the chosen detector and wavelength adequately reveal the components relevant to the test. A component that responds poorly may be hard to see. A clean-looking UV trace cannot establish the absence of every substance that the detector does not capture well.
Response must also behave suitably over the amounts being measured. Waters' peptide-mapping experiments assessed linearity, sensitivity and area reproducibility using defined samples. This illustrates why quantitative performance is demonstrated for a method, rather than assumed from the instrument name.
Retention time, peaks and identity
Retention time locates a peak within a particular chromatographic run. It helps compare sample behaviour with an appropriate reference measured under comparable conditions. It is not a universal identifying number attached to a peptide.
An expected retention time can support a method's assignment. A prominent peak alone cannot confirm identity, and another component may elute at a similar time. ICH Q2(R2), section 3.1 discusses demonstrating identification and selectivity, including challenges from closely related materials.
Ask what evidence supports the peak label. Reference comparisons, mass spectrometry or other suitable observations may contribute. A mass match also has limits, as explained in Guide #1. Do not turn either peak size or a familiar retention time into a structural conclusion the reported test has not established.
Co-elution and integration
Co-elution occurs when components emerge together without being adequately separated in the recorded trace. Their responses can overlap and be counted within one peak. A single smooth-looking peak can therefore contain more than one component. The Agilent peptide reanalysis example describes an impurity overlapping the target peak.
Separation quality matters because unresolved contributions make area assignment less secure. A shoulder may suggest overlap, but the absence of a visible shoulder does not prove the peak contains only one substance.
Integration is the processing step that sets peak boundaries and calculates areas relative to a baseline. Choices about baseline placement, shoulders, minimum peak area and the integration window can affect both the numerator and denominator. Agilent's data-analysis reference guide describes these controls. Integration should follow a justified, documented approach, rather than be adjusted simply to improve the reported number.
Solvent or blank signals may be excluded under the method. Very small signals may fall below processing thresholds. Components outside the recorded window or inadequately detected do not become part of the reported area total. Ask what the calculation includes and excludes. Neither a cropped plot nor a tidy peak table answers that question on its own.
Why methods can give different results
Column chemistry, mobile-phase composition and pH, gradient, flow and temperature can change how components separate. Detector settings and integration can change the recorded and calculated response. The method comparisons in the insulin/pramlintide study illustrate how conditions affect retention and separation.
Two results should not be treated as directly interchangeable merely because both say “HPLC”. First check whether they refer to the same sample and measurement basis, then compare method details and processing. Differences may reflect method selectivity, ordinary measurement variation or a difference in the material. A percentage alone cannot determine which explanation applies.
Eurachem's method-validation guidance places fitness for purpose, sample handling and method documentation within the assessment of analytical performance. The useful question is whether each method supports the conclusion being drawn, not which report displays more decimal places.
How to assess an HPLC purity result
| What an area result can describe | What that result alone does not establish |
|---|---|
| The assigned peak's share of the included integrated response | Its share of the original material's mass |
| The detected separation profile under the stated conditions | The absence of all possible impurities |
| The relative areas reported by the calculation | Confirmed identity from peak prominence |
| A finding for the identified tested sample | The amount in every container or the result for another batch |
Use a short review sequence:
- Connect the evidence. Match the chromatogram and peak table to the report's sample and available batch information.
- Identify the result. Is it area %, corrected area %, an assay or another expression?
- Read the method. Look for the detector, wavelength, chromatographic conditions and method reference.
- Read the total. Establish which peaks and time range were included, and whether response corrections were used.
- Check assignments. Ask how the main peak was identified and how possible overlap was assessed.
- Keep unresolved questions visible. Record missing information instead of supplying an assumed answer.
An HPLC content assay can measure an amount when supported by suitable calibration, sample handling and validation. It is a different calculation from area normalisation. Even a 99.2% area result cannot be multiplied by a 10 mg container label to create a measured peptide amount. For the broader document checks, see How to Read a Peptide Certificate of Analysis.
Reviewing HPLC evidence with Lynx
Use the Quality Assurance library to review published analytical documents alongside the available product and batch information. Check the method and measurement basis before interpreting a purity value. This guide does not add test results or establish who commissioned a particular analysis.
The Research Library provides literature context. Published research and batch analytical documentation answer different questions. Neither should be presented as a substitute for the other.
This guide concerns analytical interpretation for laboratory research. Lynx materials are for research use only, not for human or veterinary use.
Explore research materials
Browse research materials and consult the documentation for the relevant product and batch.