On this page
Understanding the three measurements
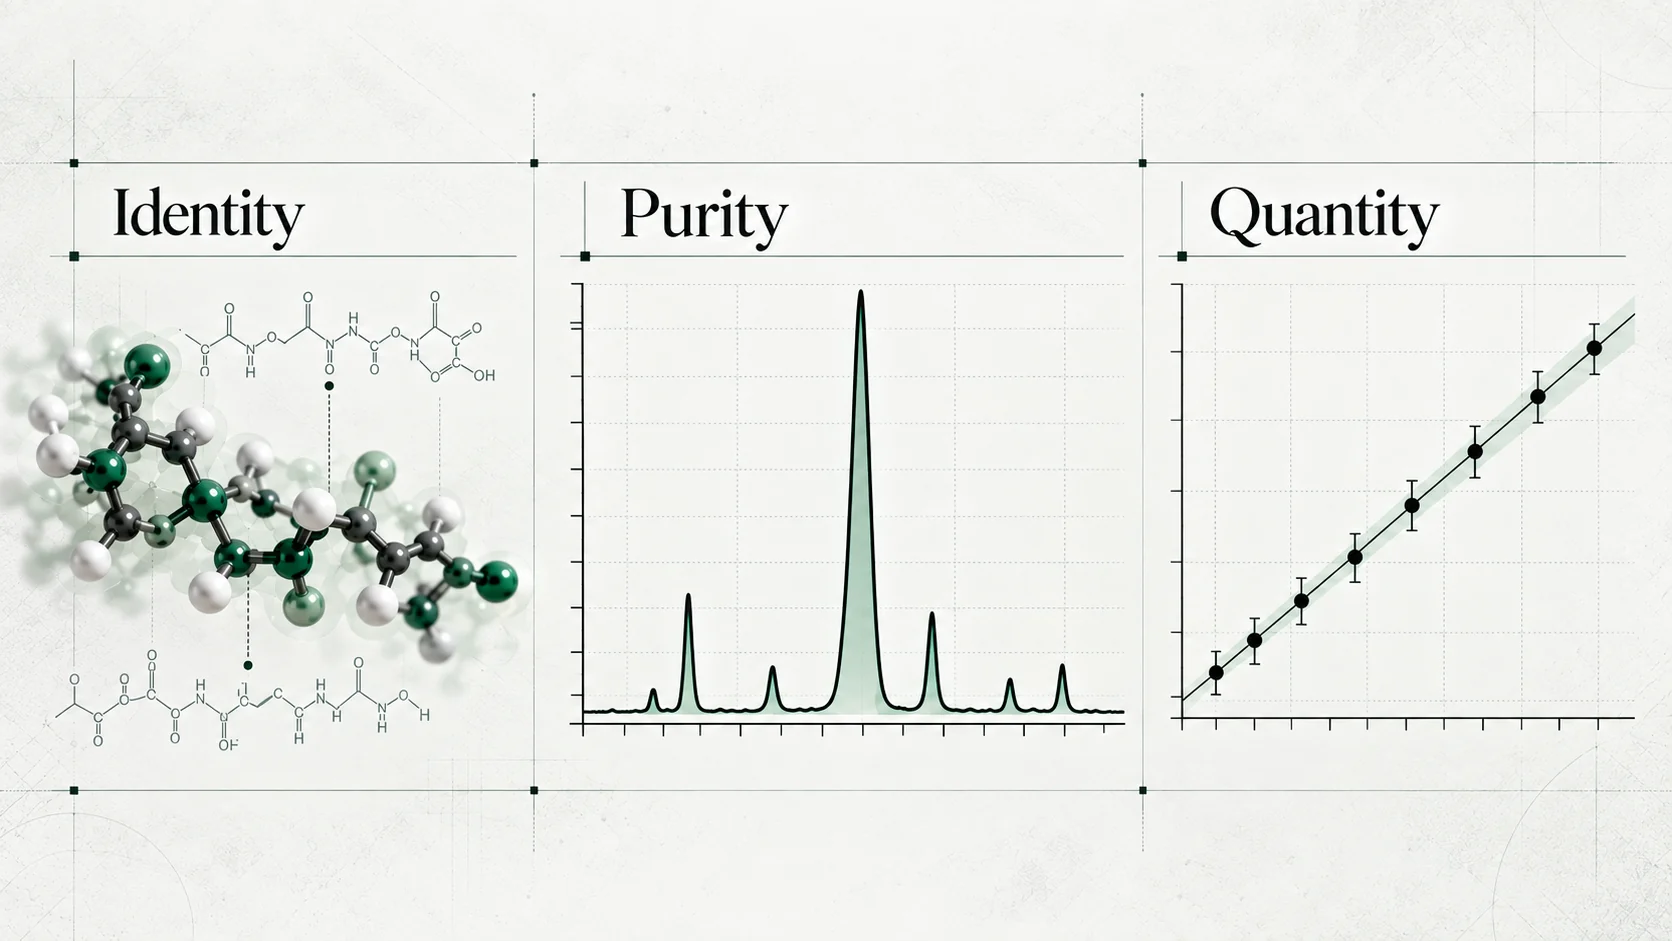
Identity, purity and quantity are related measurements, but they are not interchangeable.
Start with the question each test was designed to answer. The lab-report library is a separate resource for reviewing published analytical documents.
- Identity
- Does the evidence support the stated identity?
- Purity
- What composition does the method detect?
- Quantity
- How much specified analyte was measured?
A percentage without a method or a measurement basis can be ambiguous. Before drawing a conclusion, establish what was measured, what the result is relative to, and which characteristics were not assessed.
Identity testing
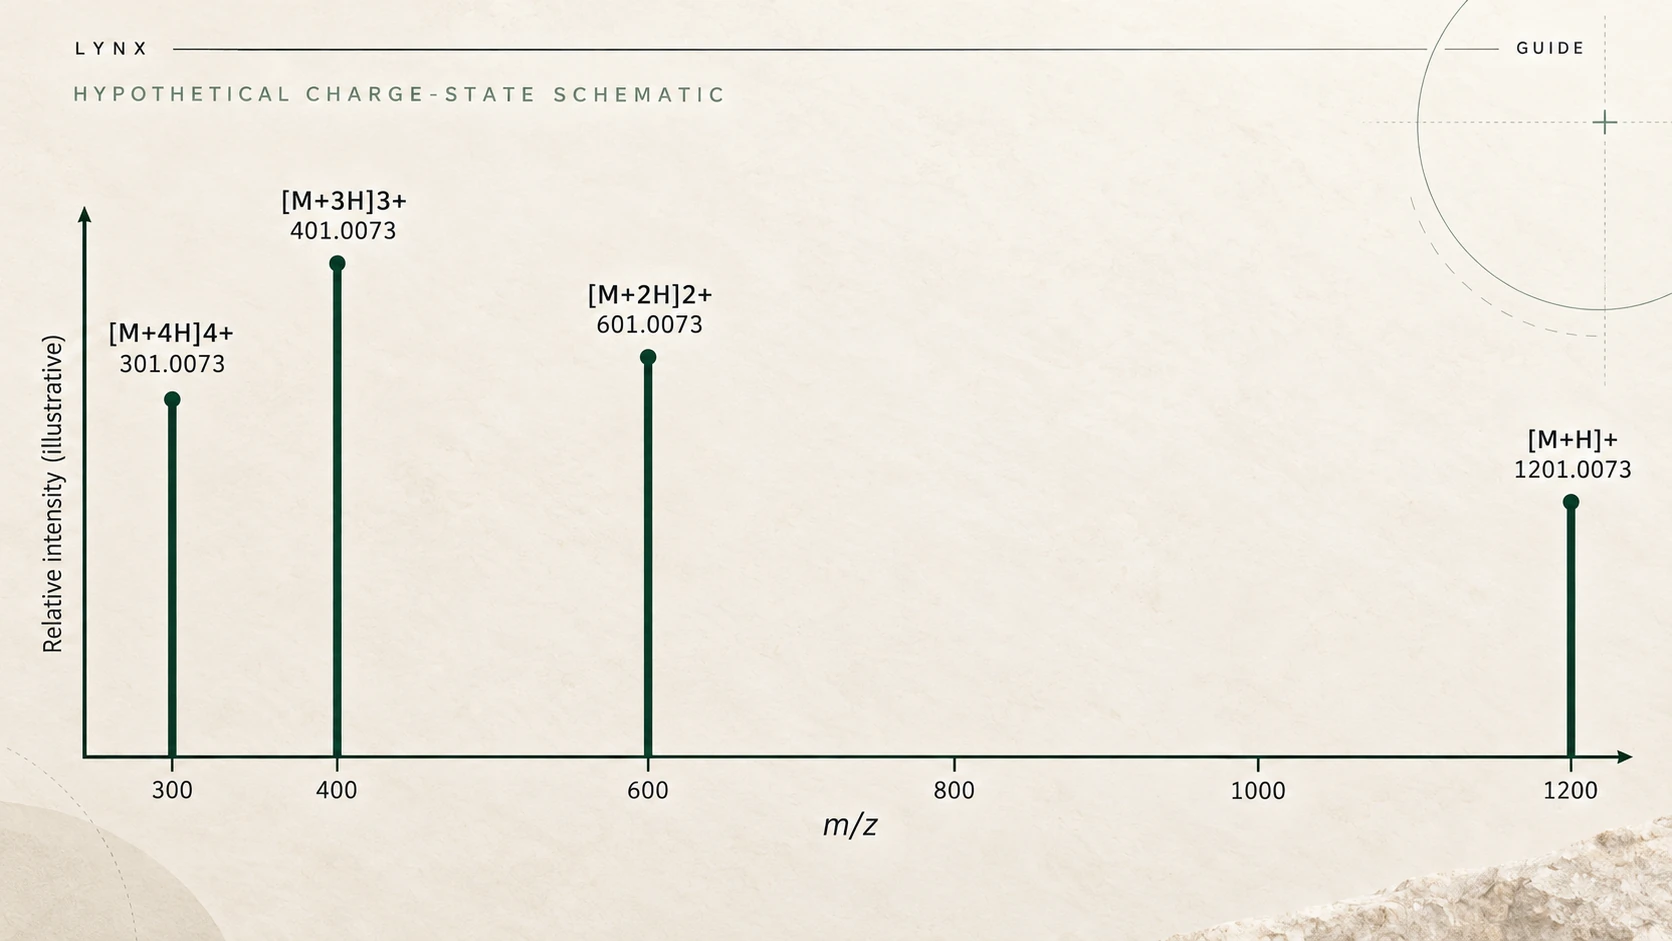
Identity testing compares analytical observations with characteristics expected for a specified substance. Mass spectrometry can provide evidence that a detected component has a mass consistent with the expected peptide. The interpretation depends on the instrument, the ion measured and the comparison used.
A matching mass supports an identity assessment but does not describe every structural feature. Different structures can share a mass. An intact-mass observation alone does not establish a unique amino-acid sequence or distinguish every possible isomer. Fragmentation data and complementary analytical observations can add information when the question requires it.
Detecting the expected component does not establish the composition of the whole sample. An identity conclusion should be read within the scope of the actual test. See NIST’s discussion of confidence in spectral matching.
Purity analysis
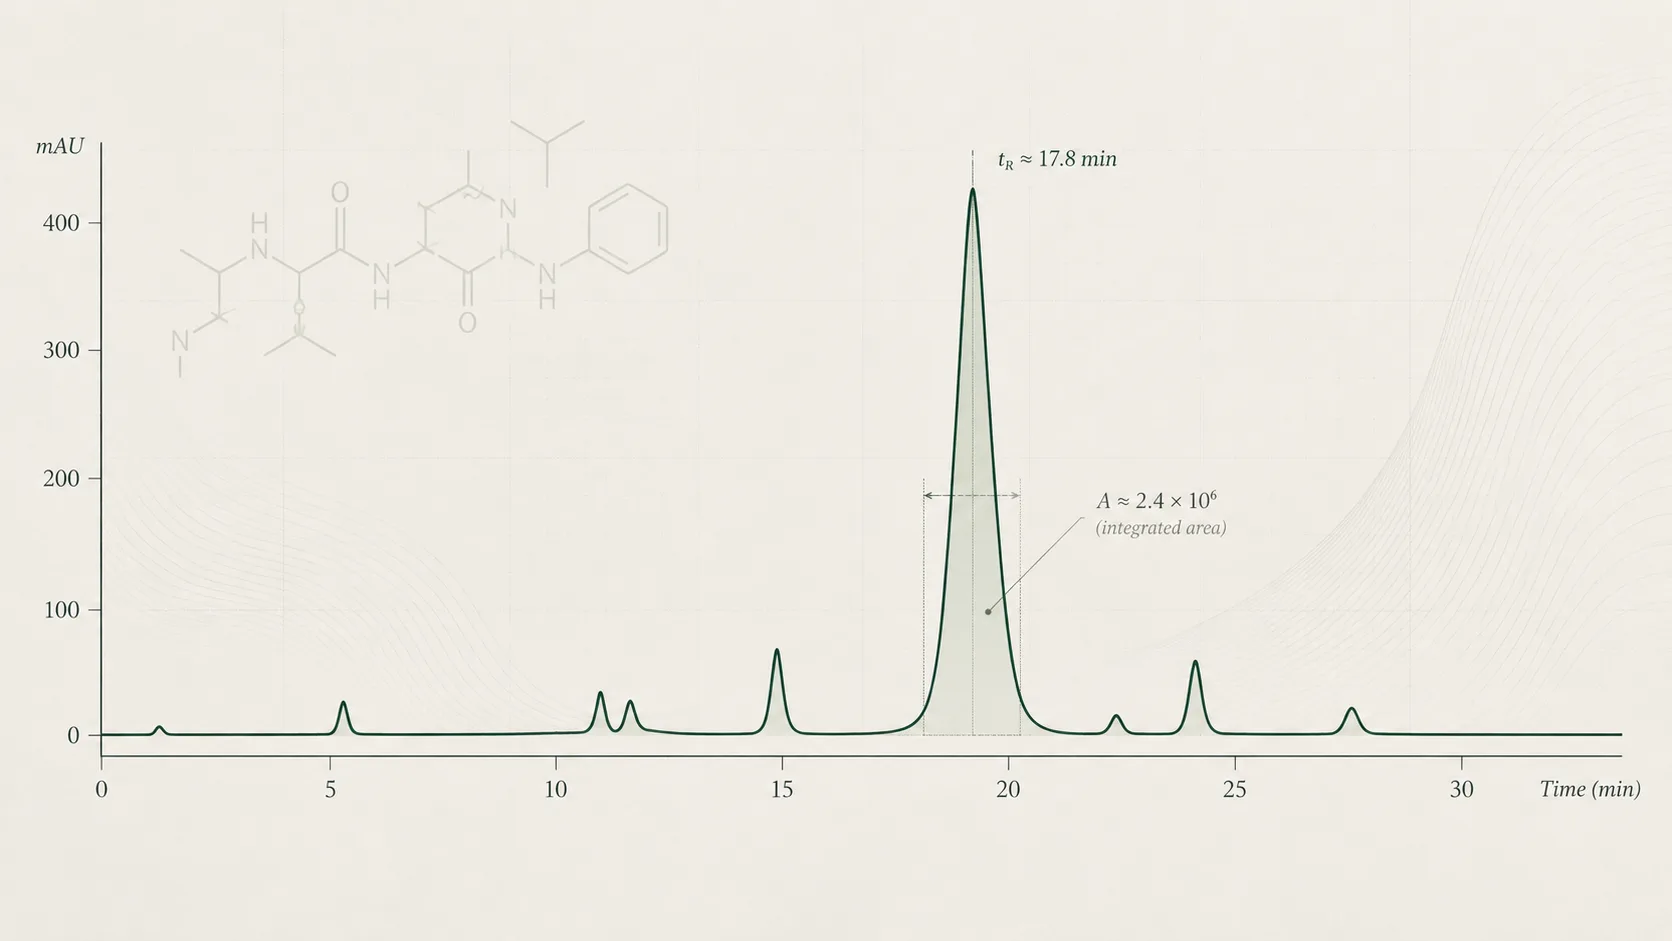
High-performance liquid chromatography (HPLC) separates sample components as they pass through a column. A detector records a signal over time, producing a chromatogram. Peaks represent detected material leaving the column under those conditions. Assigning a peak to a substance requires supporting evidence.
When a report gives chromatographic area purity, it usually expresses the assigned main peak’s integrated area relative to a defined total of integrated peak areas. Check which peaks the calculation includes and how the method treats them.
That ratio describes detector response under the method. It is not automatically a mass fraction. Different components can produce different responses, components may co-elute, and some material may not be detected or included in the calculation. Read a chromatogram within the method’s scope. It does not prove that no other material is present.
HPLC can also support a quantitative assay when appropriately calibrated and validated. The instrument name alone does not tell you whether the reported result is an area percentage or a measured amount. ICH Q2(R2) treats specificity, response, accuracy and precision in relation to the intended analytical purpose.
Quantity and content
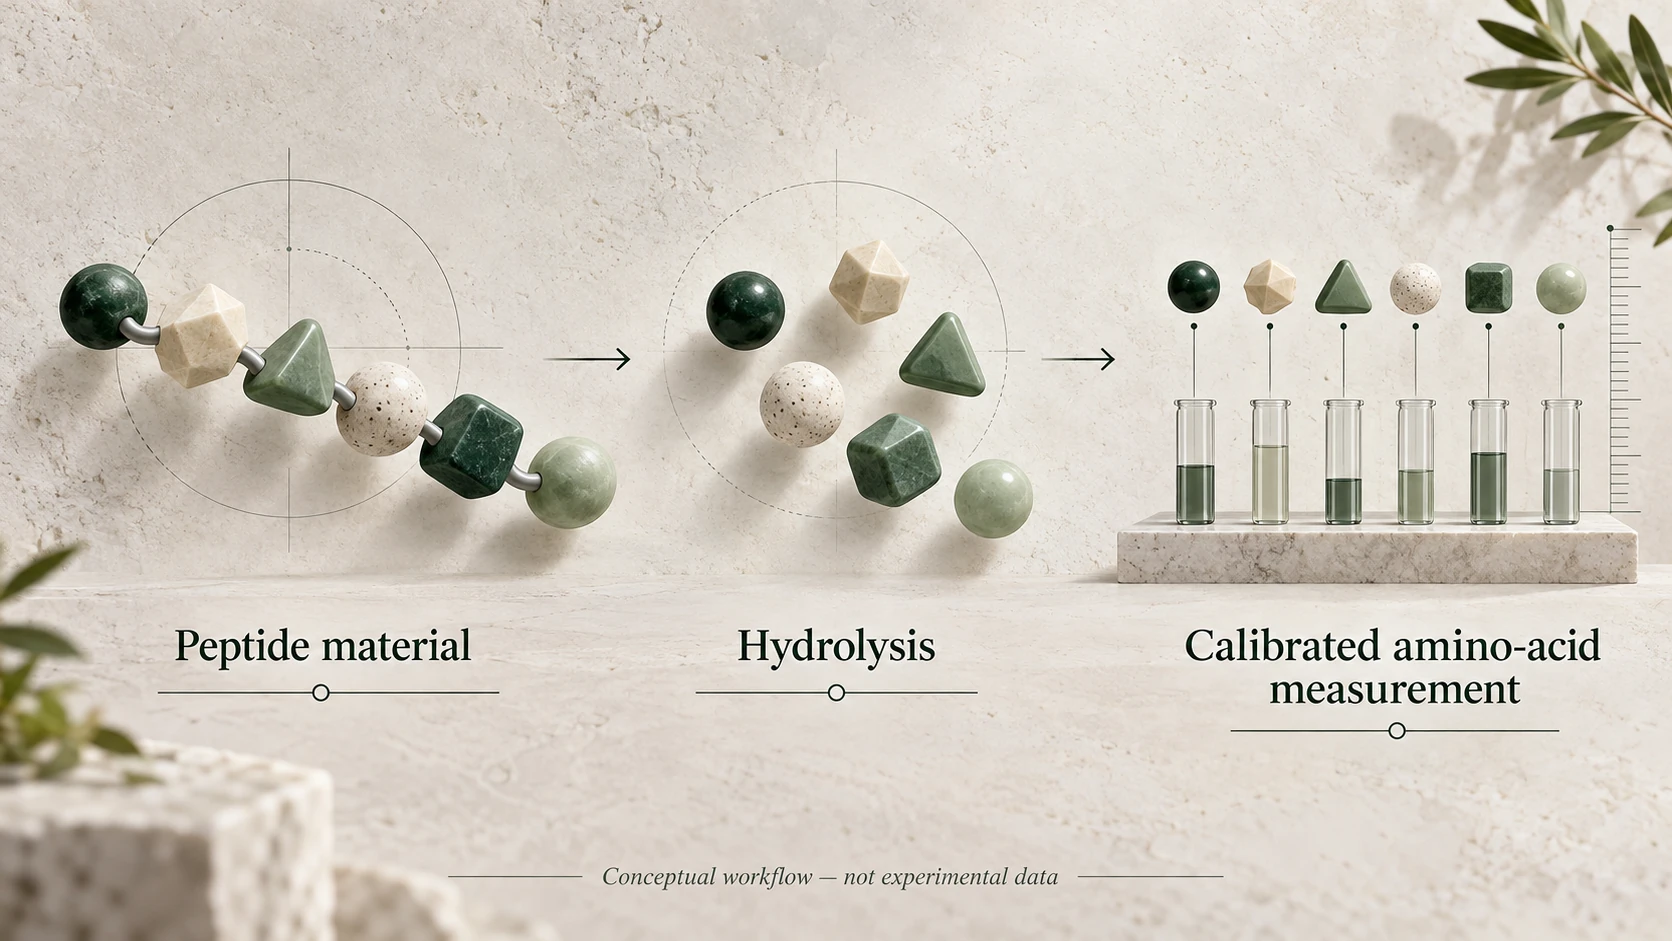
Quantity or content measurement asks how much of a specified analyte is present. A useful result states its units and measurement basis. It might report mass per sample, concentration in an analysed solution or mass fraction of a material. Each expression has a different measurement basis. They should not be substituted for one another.
Quantitative interpretation requires a suitable measurement procedure, including calibration or another justified reference approach. Sample preparation, recovery, method selectivity and measurement uncertainty can affect the conclusion. A relative peak-area percentage cannot substitute for a quantitative measurement.
The total mass of a peptide material may include water, counterions or other components. Establish whether a reported value refers to the peptide itself or to the material as received. NIST’s peptide reference-material work illustrates why assigning peptide mass fraction can require complementary measurement approaches.
Why the distinction matters
INTERPRETATION NOTEThese examples illustrate possible interpretations. They are not Lynx laboratory results or claims about any product.
A dominant chromatographic peak
A sample could have one dominant detected peak. That observation alone would not identify the peak or establish the amount of the expected peptide in the original sample.
A mass consistent with the expected peptide
A mass-based observation could support identity while leaving quantity unanswered. The presence of an expected signal is different from a calibrated measurement of content.
Complementary results
An identity test, a chromatographic profile and a content assay could each contribute evidence. Their conclusions must still refer to the same identified sample, and each retains its own limitations.
Keep each conclusion tied to its supporting test.
How to read an analytical report
An analytical report describes a particular sample tested by a specified method. It is not a blanket assessment of every batch sold under the same product name. Start by checking these details:
- Sample and batch identifier. When reviewing a report linked from the BPC-157 listing, match the tested sample to the relevant lot rather than relying on the product name. Read identity, chromatographic purity and measured content as separate findings, each requiring its own evidence.
- Test method. What technique and procedure were used? Is the result an identity observation, an area percentage or an assay?
- Reported result. Check units, calculation basis, any acceptance criterion and whether the document reports a measured value or a summary conclusion.
- Laboratory identity. Establish who performed the analysis and who issued the report. Do not infer accreditation from a logo or presentation style.
- Report date. Distinguish issue date from sample receipt or analysis dates where these are supplied.
- Limitations and context. Review method scope, qualification notes, supporting chromatograms or spectra, and any uncertainty statement. Ask for clarification if a detail needed to interpret the result is missing.
If separate documents are used together, check that their identifiers and sample descriptions are compatible. Do not combine unrelated batch results into a stronger claim than any individual report supports.
Common interpretation errors
KEY POINT
99% chromatographic purity does not establish 99% of the labelled vial quantity.
A relative peak-area percentage and a measured amount have different bases. Establish which result the report actually provides.
- “99% purity means exactly 99% of the labelled amount.”
- A chromatographic area percentage and a labelled amount have different measurement bases. One cannot confirm the other without an appropriate content measurement.
- “One analytical result proves every characteristic.”
- A result supports conclusions within its method’s scope. Identity, composition and amount may require different evidence.
- “A purity result also proves identity.”
- A peak-area calculation does not, by itself, establish what the main peak is. Peak assignment needs supporting evidence.
- “A report for the same product applies to every batch.”
- Analytical documentation should be interpreted against the sample and batch actually identified in the report.
Lynx documentation and further reading
The Quality Assurance library provides published analytical documentation. Read the specific report and its batch references before interpreting the result. This guide does not add tests or claims to those documents.
The Research Library presents research summaries and evidence limitations. Literature context and batch analytical evidence serve different purposes. The BPC-157 research overview, for example, discusses literature rather than a specific vial or batch.
Lynx materials are for research use only, not for human or veterinary use, diagnosis or treatment.
Explore research materials
Browse research materials and consult the documentation for the relevant product and batch.